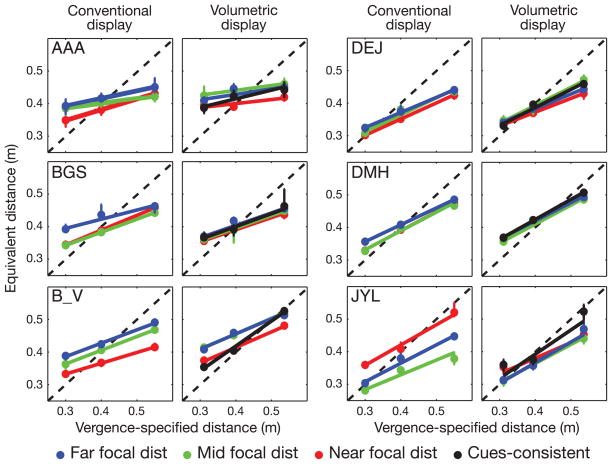
Figure 10.
Results from Experiment 3. Equivalent distance-the distance at which the disparity setting would correspond to a right angle-is plotted as a function of vergence distance. The left columns on each half of the figure show the data obtained with the conventional display. The right columns show the data obtained with the volumetric display. Each row on each half of the figure shows the data from a different observer. The abscissa in each plot is the vergence distance. The ordinate is the equivalent distance (Equation 5). The diagonal dashed lines represent the predicted data if equivalent distance were based solely on the vergence-specified distance. The red, green, and blue points represent the cues-inconsistent data from the near, mid, and far focal distances, respectively (note that 1/3 of those points are in fact cues-consistent). The colored lines are regression fits to those data points. Error bars are 95% confidence intervals. The black lines in the right column represent the data from the cues-consistent session.

