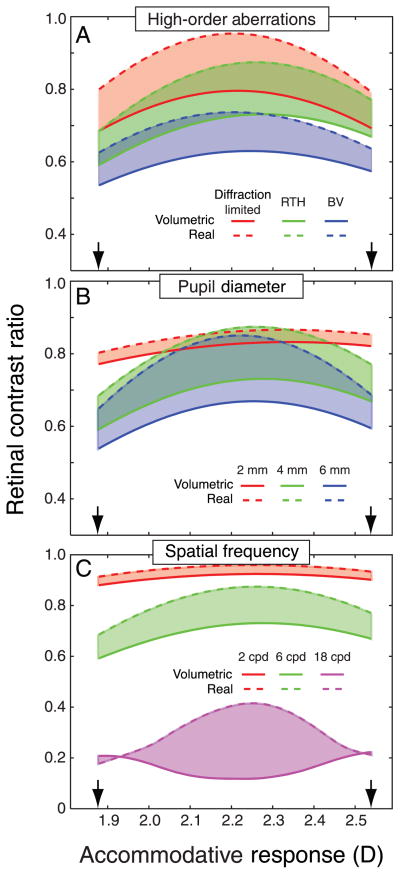
Figure 14.
Retinal images with real-world and volumetric viewing. In each panel, the abscissa is the accommodative response in diopters and the ordinate is the retinal-contrast ratio: retinal-image contrast divided by object contrast. The real-world stimulus is always presented at 2.21 D. The volumetric stimulus is always presented on image planes at 1.87 and 2.54 D (represented by the arrows) to simulate an object at 2.21 D; this mimics the situation in our volumetric display. The dashed and the solid lines represent the contrast ratios created by real and volumetric stimuli, respectively; the shaded areas represent the difference. The stimulus in every case is a vertical sinusoidal grating. (A) The effect of viewer’s optical aberrations. Pupil diameter is 4 mm and stimulus spatial frequency is 6 cpd. The red, green, and blue curves represent respectively the contrast ratios for a diffraction-limited eye, the eye of a viewer with typical aberrations, and the eye of a viewer with larger-than-typical aberrations. (B) The effect of pupil size. The viewer has typical aberrations. The stimulus is 6 cpd. The red, green, and blue curves represent the contrast ratios for pupil diameters of 2, 4, and 6 mm, respectively. (C) The effect of stimulus spatial frequency. The viewer has typical aberrations and pupil diameter is 4 mm. The red, green, and blue curves represent the contrast ratios for spatial frequencies of 2, 6, and 18 cpd, respectively.

