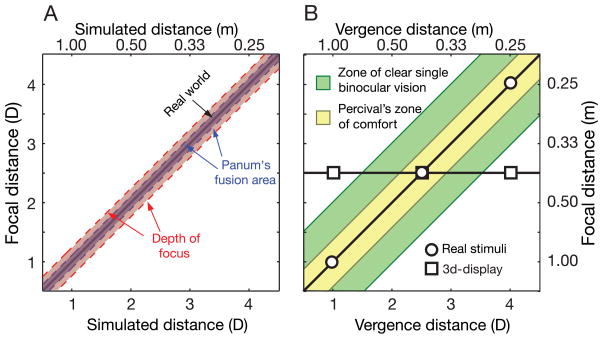
Figure 2.
Consequences of vergence–accommodation coupling. The panels plot focal distance as a function of simulated (or vergence) distance. The bottom abscissa and the left ordinate have units of diopters. The top abscissa and the right ordinate have the corresponding values in meters. (A) Depth of focus and Panum’s fusion area in diopters. Here we simulate real objects, so the vergence and the focal distances specified by the object are equal to one another. The diagonal line represents the viewer’s vergence and accommodation assuming accurate responses to the object. Vertical cross sections of the red region represent the eye’s depth of focus. Horizontal cross sections of the blue region represent Panum’s fusion area (15 arcmin). Note that the sizes of the zones of clear vision and of single vision remain constant in diopters. Because of this, we will express simulated and vergence distances in diopters instead of in meter-angles, which are the conventional units in optometry and ophthalmology. (B) Zones of clear single vision and of comfort. The green area represents the zone of clear single binocular vision: the range of vergence and accommodative responses that young adults can achieve without excessive effort and without exceeding depth of focus or Panum’s area. The yellow area represents Percival’s zone of comfort: the range of responses viewers can achieve without discomfort. Circles represent three real-world stimuli; squares represent the corresponding stimuli on a conventional 3D display.

