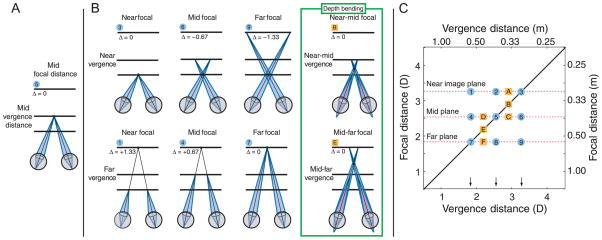
Figure 6.
The conditions in Experiments 1 and 2. The horizontal lines represent the image planes in the apparatus. The thin black lines represent the visual axes of the eyes; those axes intersect at the vergence distance. The light blue regions represent the focal distance. Panel A represents the fixation stimulus before the presentation of the test stimulus. Δ is the difference in diopters between the vergence and the focal distances. Panel B depicts eight of the test stimuli in the experiments. For the stimuli marked 3, 7, B, and E, the focal and the vergence distances were equal to one another (cues-consistent). The rightmost column, outlined in green, depicts the two stimuli with depth-weighted blending (see General methods section). In these stimuli, the vergence distance was the dioptric midpoint between two image planes; 50% of the light came from each of those planes. Panel C represents all the stimuli in the experiments. The horizontal dashed lines represent the three image planes. The vertical arrows represent the vergence distances. Stimuli at positions 1, 3, 4, 5, 6, 7, 9, A, B, C, D, E, and F were presented in Experiments 1 and 2; in B and E, the focal stimuli are depth-weighted blends. Experiment 3 used stimuli at 1–9. Experiment 4 used stimuli at 4, 5, and 6 for the cues-inconsistent session, and stimuli at 3, 5, and 7 in the cues-consistent session.

