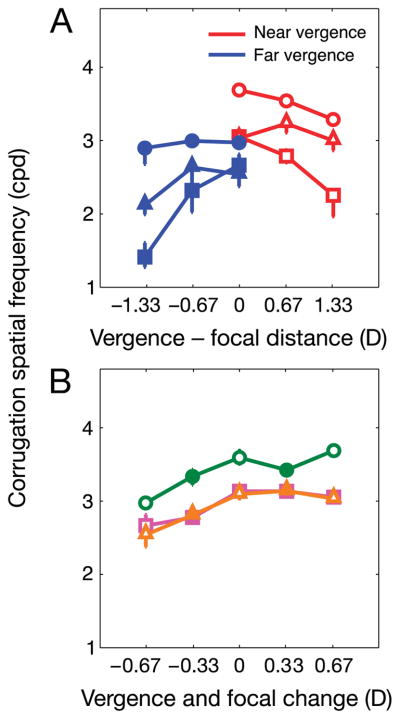
Figure 8.
Results from Experiment 2. The format is the same as Figure 7 except the ordinate represents the highest spatial frequency at which observers could identify the corrugation orientation correctly 75% of the time. (A) Results for non-blended stimuli with near or far vergence distances. The abscissa represents the conflict between the vergence and the focal distances in diopters. The data for the ±0.33 D conflicts are not shown. Different symbol types represent the data from different observers: squares for ARG, triangles for DS, and circles for BGS. The blue filled symbols represent the data for far vergence distances and the red unfilled symbols the data for near vergence distances. Error bars represent 95% confidence intervals. (B) Results for cues-consistent stimuli. The abscissa represents the change in the vergence and the focal distance from the fixation to the test stimulus; positive values are changes in which the distance decreased and negative values are those in which the distance increased. Purple squares are data for ARG, orange triangles for DS, and green circles for BGS. The unfilled symbols are data with non-blended stimuli presented at an image plane, and the filled symbols are data with blended stimuli presented between image planes. Error bars are 95% confidence intervals.

