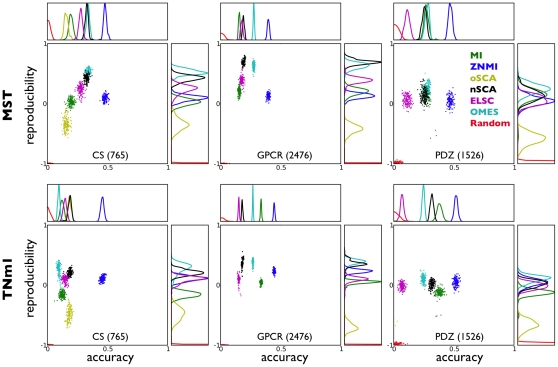
Figure 3. Reproducibilty and accuracy for published algorithms on three different families.
Scatterplots and histograms of reproducibility and accuracy for the three protein families (PDZ, 1256 sequences, CS, 765 sequences, GPCR, 2476 sequences) we consider in the text. The methods are Random (red), MI (green), old SCA (yellow), new SCA (black), OMES (cyan), ELSC (magenta), and ZNMI (blue). The top row shows the results when we construct the consensus network using MST, and the bottom with TNm1. The y axes on the reproducibility histograms have been rescaled to allow better visualization of the shapes of the distributions. The line colors shown in the GPCR MST panel are used consistently throughout. The old version of SCA often produces accuracies below that of random (near zero, left side of each plot); see the text for further discussion on this point.

