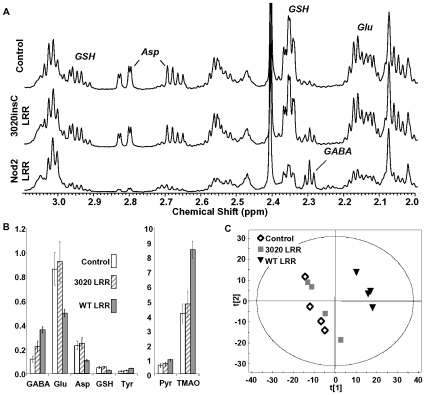
Figure 2. Nod2 LRR domains impact bacterial metabolism.
A, Expansion of 1H-NMR spectrum (δ1H 3.1 to 2.0 ppm) of cell extracts from Control (BSA treated), Nod2 LRR and Nod2 3020insC LRR domains as indicated. B, Metabolic perturbation induced by Nod2 LRR and Nod2 3020incC LRR treatment in E. Coli. GABA; γ-aminobutyrate, Glu; glutamate, Asp; aspartate, GSH; glutathione, Tyr; tyrosine, Pyr; pyruvate, TMAO; trimethylamine oxide. All metabolite changes indicated with Nod2 LRR were statistically significant versus control E.coli (p<0.05, Student's T-test). The data are summarised in Table S1. C, Principle component analysis (PCA) score plot of E.coli metabolism treated as indicated with LRR domains from Nod2, Nod2 3020insC or BSA. PCA of the NMR data was performed using SIMCA-P v.10 (Umetrics AB, Umeå, Sweden). This data reduction method allows the visualization of the effect of treatment on the cellular metabolism, the clustering of groups of data is based solely on the similarity of the input spectral data. Each symbol represents the 1H-NMR spectrum of an individual cell extract. The axis, principal component 1 (t[1]) and 2 (t[2]), represent the top two most abundant correlated variation within the data set. The separation of the WT LRR from the Control and 3020incC LRR cells is due to specific perturbations in cellular metabolism.

