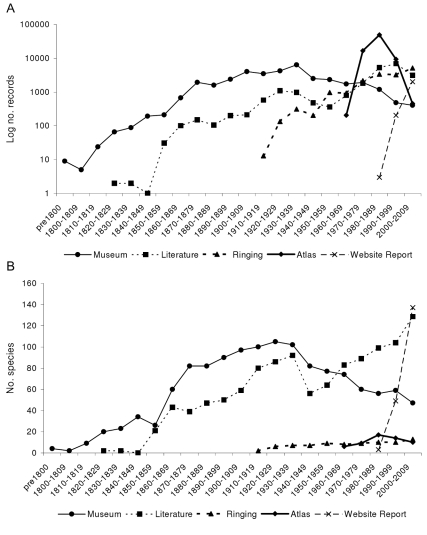
Figure 1. The contribution of data sources over time.
A) shows the number of records contributed by each data source within each time period, and B) shows the number of species recorded by each data source within each time period. The number of records for 2000–2006 has been extrapolated to 2000–2009 for ease of comparison with the other decades.

