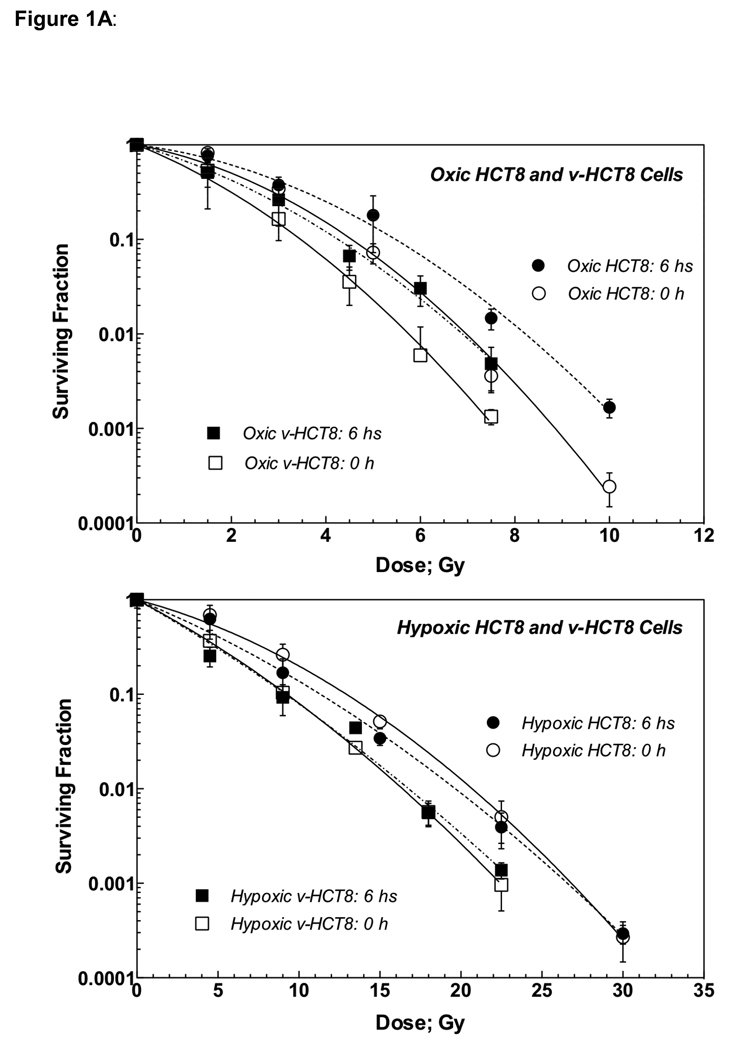
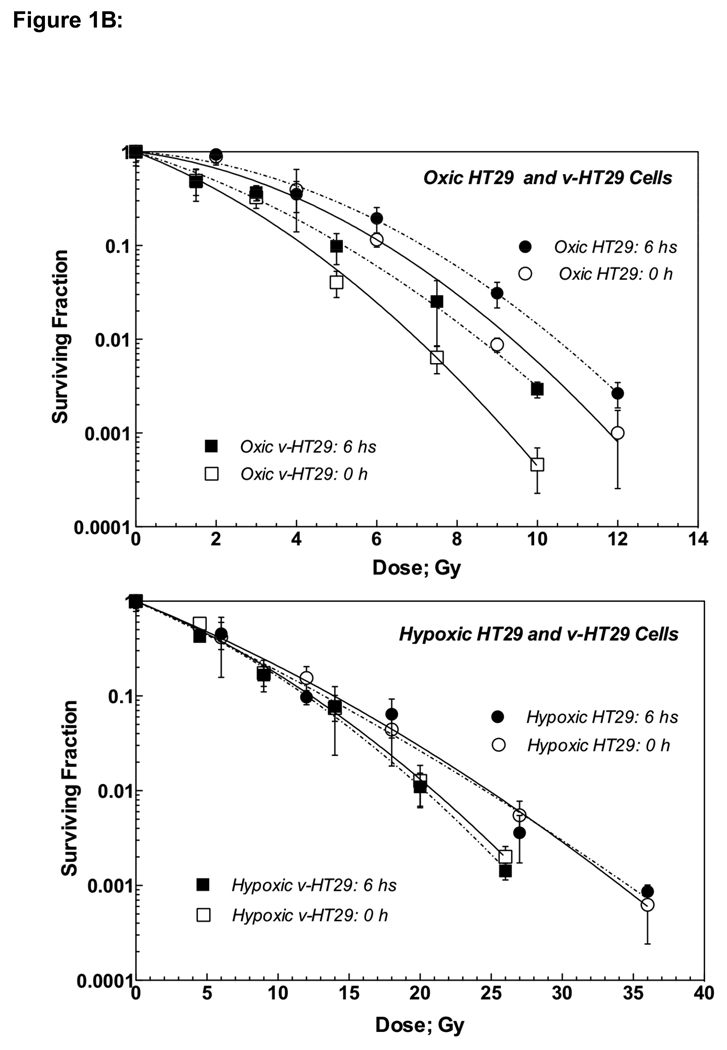
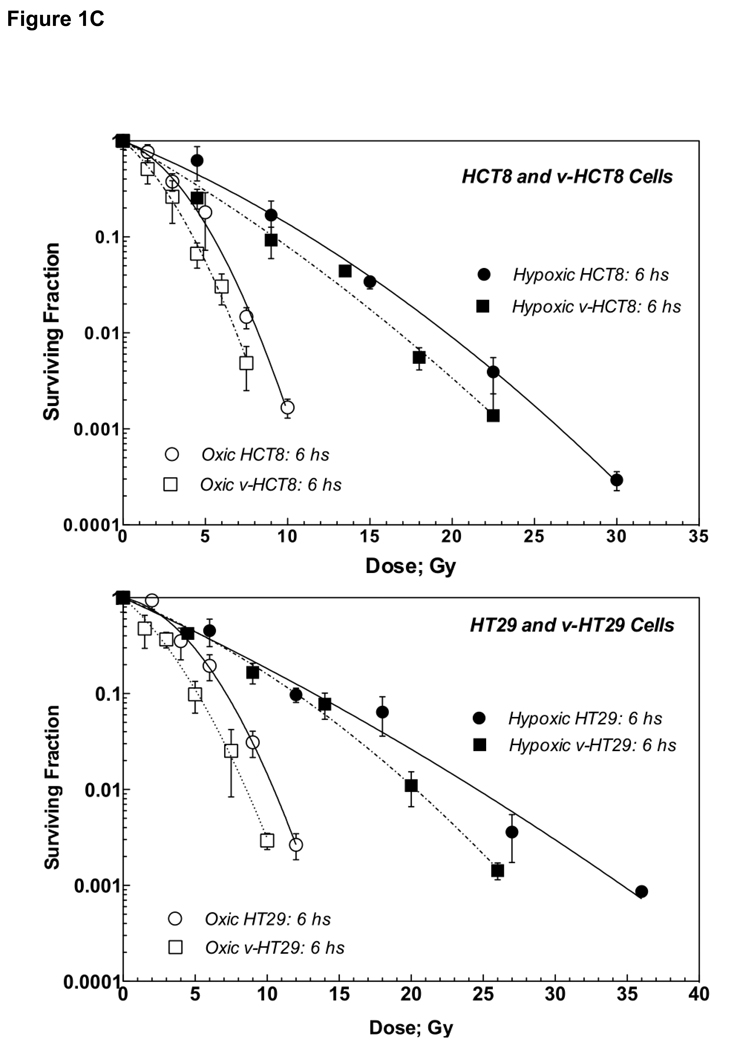
Figure 1.
Figure 1A: Radiation dose-cell survival curves of parental HCT8 and v-HCT8 (DNKu70 virus-infected) cells irradiated under aerobic (upper) and hypoxic (lower) conditions in vitro. Open symbols with solid lines and solid symbols with dotted lines indicate cells trypsinized immediately and 6 h post-irradiation, respectively. Circles and squares show HCT8 and v-HCT8, respectively.
Figure 1B: Radiation dose-cell survival curves of parental HT29 and v-HT29 (DNKu70 virus-infected) cells irradiated under aerobic (upper) and hypoxic (lower) conditions in vitro. Open symbols with solid lines and solid symbols with dotted lines indicate cells trypsinized immediately and 6 h post-irradiation, respectively. Circles and squares show HT29 and v-HT29, respectively.
Figure 1C: Survival curves of cells irradiated under aerobic and hypoxic conditions in vitro shown together for comparison. Cells trypsinized 6 h after irradiation is shown. Upper panel shows HCT8 and v-HCT8, and lower panel HT29 and v-HT29 (DNKu70 virus-infected) cells. Open and solid symbols indicate cells irradiated under aerobic and hypoxic conditions, respectively. Circles and squares symbols indicate parental and virus-infected, respectively.


