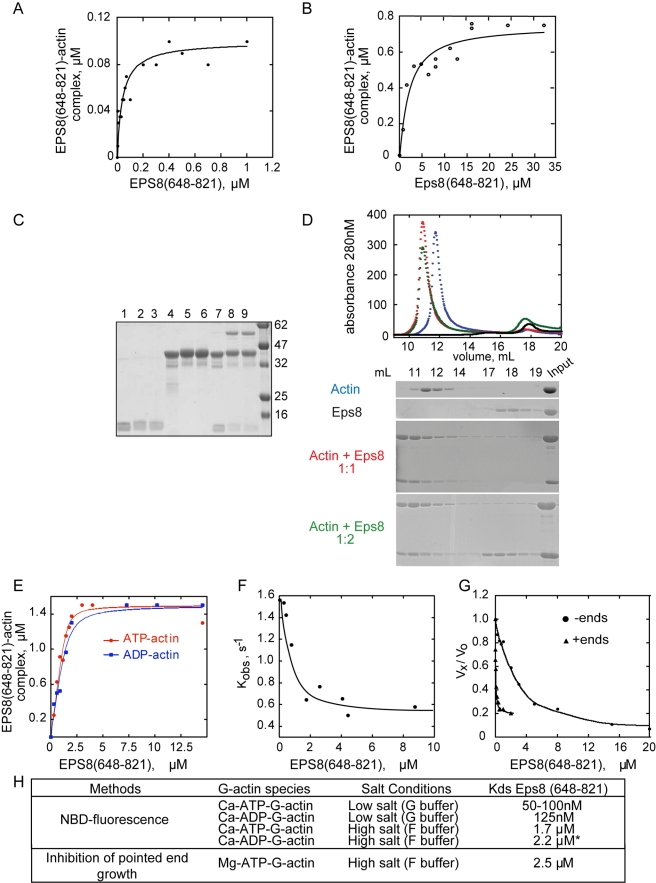
Figure 1. Eps8(648–821) binds monomeric actin and inhibits ATP-dissociation from ATP-Ca-G-Actin.
(A–B) Eps8(648–821) binds monomeric actin. The change in fluorescence of NBD-labeled-actin was measured at different concentrations of Eps8(648–821), in either (A) low salt (G-buffer) or (B) in high salt (F buffer) buffer containing 0.1 M KCl and 1 mM MgCl2. Symbols indicate data; solid line indicates fitted binding curve for a complex with a 1∶1 stoichiometry. The curve is calculated using Equation 1 in the “Experimental Procedure.” (C–D) Eps8(648–821) forms a 1∶1 complex with actin. (C) Chemical cross-linking revealed that Eps8(648–821) and actin form a 1∶1 complex. Eps8(648–821) and actin, either alone or in combination, were incubated for various lengths of time in the absence or presence of PPDM, separated by SDS-PAGE and detected by Coomassie blue staining. Lanes 1, 2, 3: 10 µM of Eps8(648–821) incubated in the absence (Lane 1) or the presence of the cross-linker for 5 min (Lane 2) or 15 min (Lane 3); Lanes 4, 5, 6: 10 µM of actin alone incubated in the absence (Lane 4) or the presence of PPDM for 5 min (Lane 5) and 15 min (Lane 6); Lanes 7, 8, 9: 10 µM of Actin (10 µM) and Eps8(648–821) incubated in the absence (Lane 7) or the presence of PPDM for 5 (Lane 8) and 15 (Lane 9) min. Molecular weight markers are also shown and indicated on the right. (D) Eps8 C-terminal domain and Actin co-elute in gel filtration forming a 1∶1 complex. Size exclusion chromatography experiment on a Superdex 200 10/30 column in G buffer (2 mM TRIS pH 7.8, 0.2 mM ATP, 1 mM DTT, 0.1 mM CaCl2). Purified Actin and Eps8(648–821) were analyzed by gel filtration either alone (blue and black line, respectively) or after pre-incubation on ice for 1 h in a 1∶1 or 1∶2 molar ratio (red and green line, respectively). In each case, 30 uL fractions were collected and analyzed by Coomassie staining on 10% SDS-PAGE gel, which is shown beneath the elution profile. (E) Eps8(648–821) binds ATP- and ADP-G-actin with similar affinities. The change in fluorescence of 1.5 µM NBD-ADP-G-actin (blue line, closed squares) or NBD-ATP-G-actin (red line, closed circles) was measured at different concentrations of Eps8(648–821), in G-buffer. ATP to ADP exchange was performed using Hexokinase in the presence of 10 mM MgCl2 and 1 mM glucose. Symbols indicate data; solid lines indicate fitted binding curves for a complex with 1∶1 stoichiometry. The affinity constants calculated from these plots using the equation described in the Materials and Methods section were Kd(ATP-Ca-G-Actin) = 75 nM, Kd(ADP-Ca-G-Actin) = 125 nM. (F) Eps8(648–821) inhibits the dissociation of ATP from ATP-G-Actin. ATP-G-actin (2 µM, in G-buffer containing 20 µM of CaCl2) was supplemented with the indicated concentrations of Eps8(648–821). The dissociation of bound ATP was monitored by adding 5 µM of εATP at time 0 and recording the subsequent increase of fluorescence of εATP. The pseudo-first order exchange rate constant is plotted versus the total concentration of Eps8(648–821). (G) Barbed and pointed end elongation rate of actin in the presence of Eps8(648–821). The rate of elongation was measured from pointed ends (circles), using gelsolin-actin seeds (5 nM) and 2 µM of G-actin (10% pyrenyl-labeled), or from barbed ends (triangles) using spectrin-actin seeds, in the presence of increasing concentrations of Eps8(648–821), as indicated. Rates are normalized taking as 100% the rate of elongation from either pointed or barbed ends measured in the absence of Eps8(648–821). (H) Summary of the equilibrium parameters for binding of Eps8(648–821) to monomeric actin measured under the different conditions and methodology indicated above.

