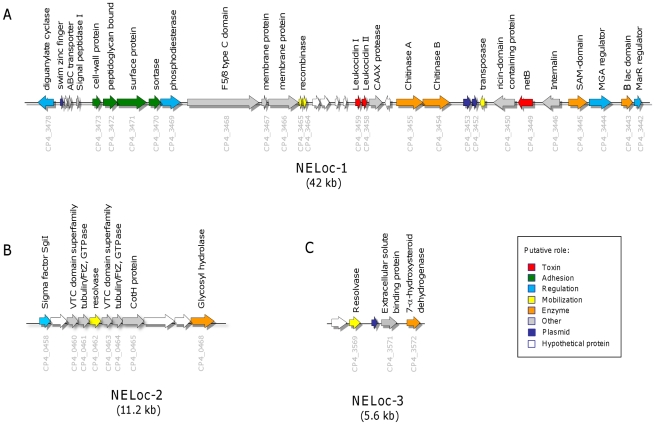
Figure 1. Genetic organization of NE-specific loci.
The genetic organization of (A) NELoc-1, (B) NELoc-2 and (C) NELoc-3 is shown, each arrow representing a predicted gene and the total size given below each locus. Predicted functional annotations and locus tags are shown above and below each gene, respectively. Genes are colour-coded by their putative role based upon sequence analyses.

