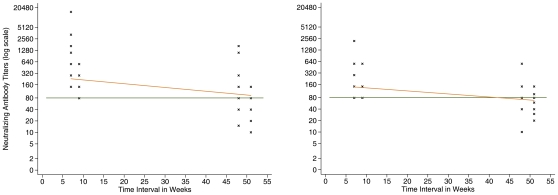
Figure 1. H5 neutralizing antibody titers by H5pp (1a) and MN (1b) tests in 31 asymptomatic/mild individuals.
Orange lines: Fig. 1a: Linear regression line (slope of –0.06, p value = 0.172). Fig1b: Linear regression line (slope of –0.31, p value = 0.024). Cross points: Seropositive cases' neutralizing antibody titers at Weeks 7, 9, 48 and 51 after exposure (n = 54). Green line: Threshold titer at 80.

