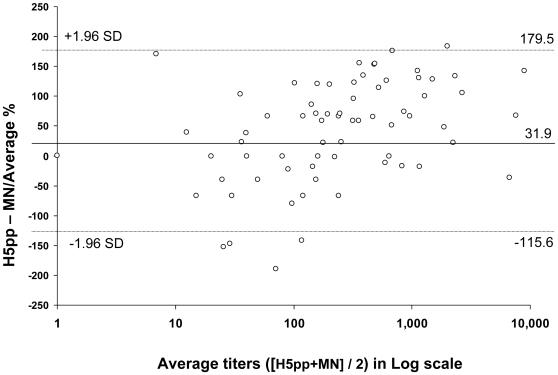
Figure 3. Comparison of H5pp and MN tests by Bland & Altman method.
On the x axis, the means of the H5 titers observed with the two methods are shown for individual samples. On the y axis, the difference between the methods divided by the means of the titers presented in percent. The limits of agreements are depicted. A total of 101 sera were included in the analysis. Bland and Altman plot, N = 101. Bias: 31.9% [95% Confidence Interval = +17.1% to +46.7%]. Limits of agreement = −115.6% and +179.5%.

