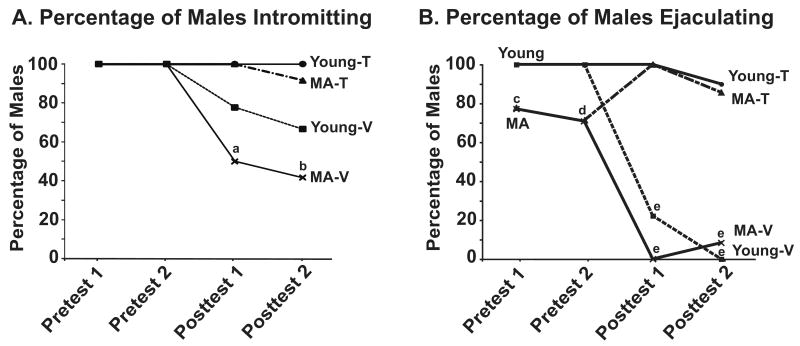
Figure 2.
Behavioral analyses of the two pre-tests and two post-tests are shown. The mean percentages of males intromitting and ejaculating are shown in panel A and B. Data for the pre-tests are shown combined for each age. For the post-tests, data for the four groups (young-T, young-V, MA-T, MA-V) are shown separately. In post-test 1 and post-test 2, the percentage of males intromitting were significantly higher in the young-T and MA-T compared to the MA-V group (a: P < 0.05 and P < 0.001 compared to the corresponding young-T group and MA-T respectively; b: P < 0.001 and P < 0.05 compared to the corresponding young-T group and MAT respectively. The percent of males ejaculating was significantly higher for young than middle-aged males (c: P < 0.05; d: P < 0.01). In Post-test 1 and Post-test 2, Fisher's Exact test was used with the young-T and MA-T groups as the bases of comparison. These groups were significantly different than the young-V and MA-V groups (e: P < 0.001 for all comparisons). Sample sizes were: Young-T (n=9), Young-V (n=9), MA-T (n=14), and MA-V (n=13). Abbreviations: MA, middle-aged; T, testosterone; V, vehicle.

