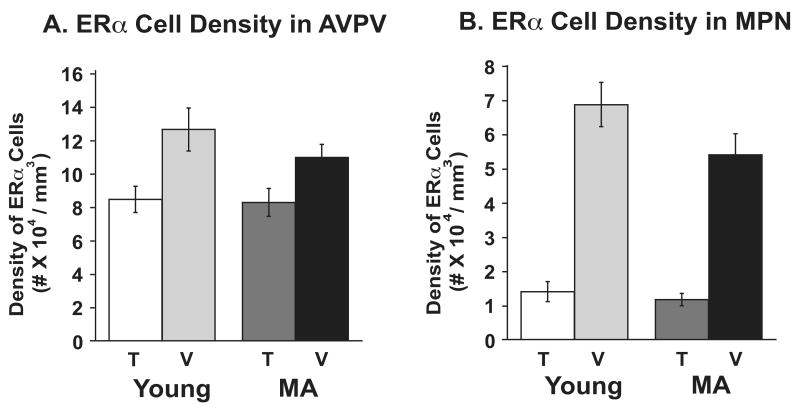
Figure 7.
Stereologic analysis results of ERα-immunoreactive cell density (number of immunoreactive cells/regional volume) are shown for the AVPV (panel A, n=6 rats per group) and the MPN (panel B, n=6 rats per group). The bars represent the mean ± SEM. ERα-cell density was significantly lower in T-treated rats of both ages in AVPV (P < 0.01) and MPN (P < 0.0001). Abbreviations: AVPV, anteroventral periventricular nucleus; MPN, medial preoptic nucleus; T, testosterone; V, vehicle; MA, middle-aged.

