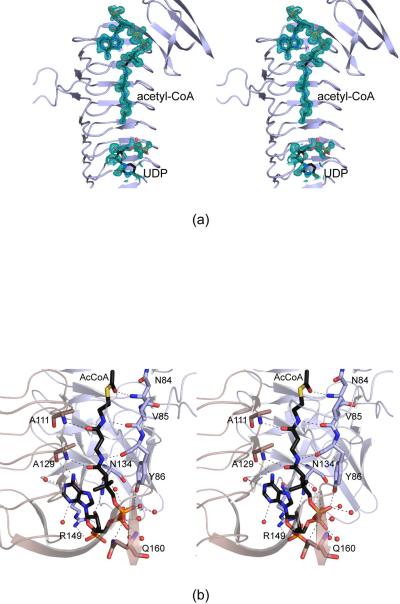
Figure 3.
Active site architecture for the WlbB/acetyl-CoA/UDP complex model. Shown in (a) is the initial electron density corresponding to the bound ligands (before they were included in the model). The map was contoured at ~1.5σ and calculated with coefficients of the form (2Fo - Fc), where Fo was the native structure factor amplitude and Fc was the calculated structure factor amplitude. Those amino acid residues lying within ~3.2 Å of acetyl-CoA are shown in (b). The active site is formed by residues contributed from two subunits in the trimer as indicated by the wheat and blue bonds and ribbon representations. Water molecules are depicted as red spheres, and potential hydrogen bonds are indicated by the dashed lines.

