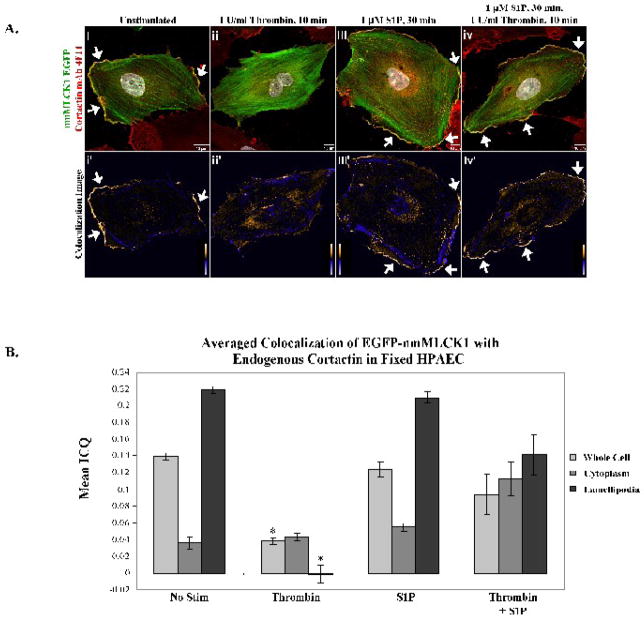
Figure 3. Colocalization of EGFP-nmMLCK1 and endogenous cortactin in human lung endothelial lamellipodia.
Panel A. EC overexpressing EGFP-nmMLCK1 were incubated with either vehicle (i), thrombin for 10 min (ii), S1P for 30 min (iii), or thrombin for 10 min followed by S1P for 30 min (iv) at 37°C, then fixed and immunostained for cortactin (red). Yellow indicates areas of colocalization. The lower panels, i′-iv′, depict colocalization of endogenous cortactin with nmMLCK1. Warm colors indicate pixels with positive mean deviation products, where cortactin and nmMLCK1 fluorescence intensities rose in synchrony above the cellular average intensity, thus indicating colocalization. Blue pixels represent regions with negative mean deviation products in which the cortactin and nmMLCK1 fluorescence intensities varied independently of each other. Shown are representative images selected from 4–20 images for each treatment. Panel B: The mean ICQ values for cortactin and EGFP-nmMLCK1 colocalization were calculated as described in Methods for the entire cell, the cytoplasm, and the lamellipodia under each condition [vehicle (No stim), thrombin for 10 min, S1P for 30 min, or thrombin for 10 min followed by S1P for 30 min]. Thrombin induces a statistically significant reduction in peripheral as well as whole-cell colocalization of nmMLCK1 with cortactin when compared to unstimulated (whole cell or lamellipodia, *p <0.001) and S1P-stimulated cells (whole cell or lamellipodia, *p <0.004). N = 4–20 per condition.

