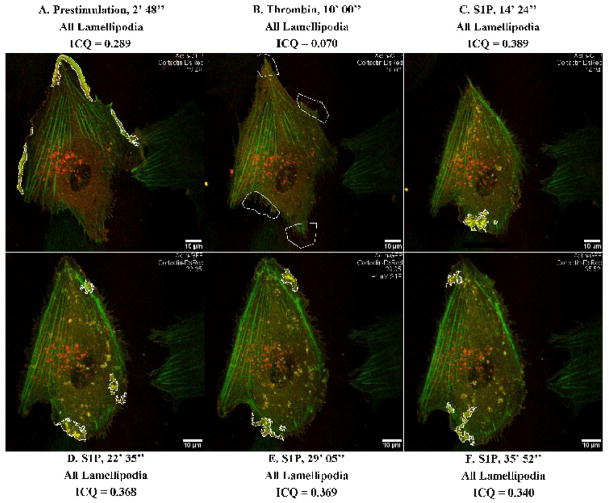
Figure 5. Dynamic colocalization of actin-GFP and cortactin-DsRed with intensity correlation analysis applied to live-cell imaging.
HPAEC were cotransfected with actin-GFP and cortactin-DsRed constructs and then subjected to live cell imaging as described in Methods. The panels represent images from an extended movie (see Supplemental Movie 1) depicting dynamic colocalization of cortactin-DsRed and actin-GFP in a single EC under basal conditions (A), after thrombin stimulation (B), and subsequent S1P stimulation (C–F). Yellow indicates areas of colocalization. ICQ quantitation for actin-cortactin colocalization in outlined lamellipodia is shown for each panel.

