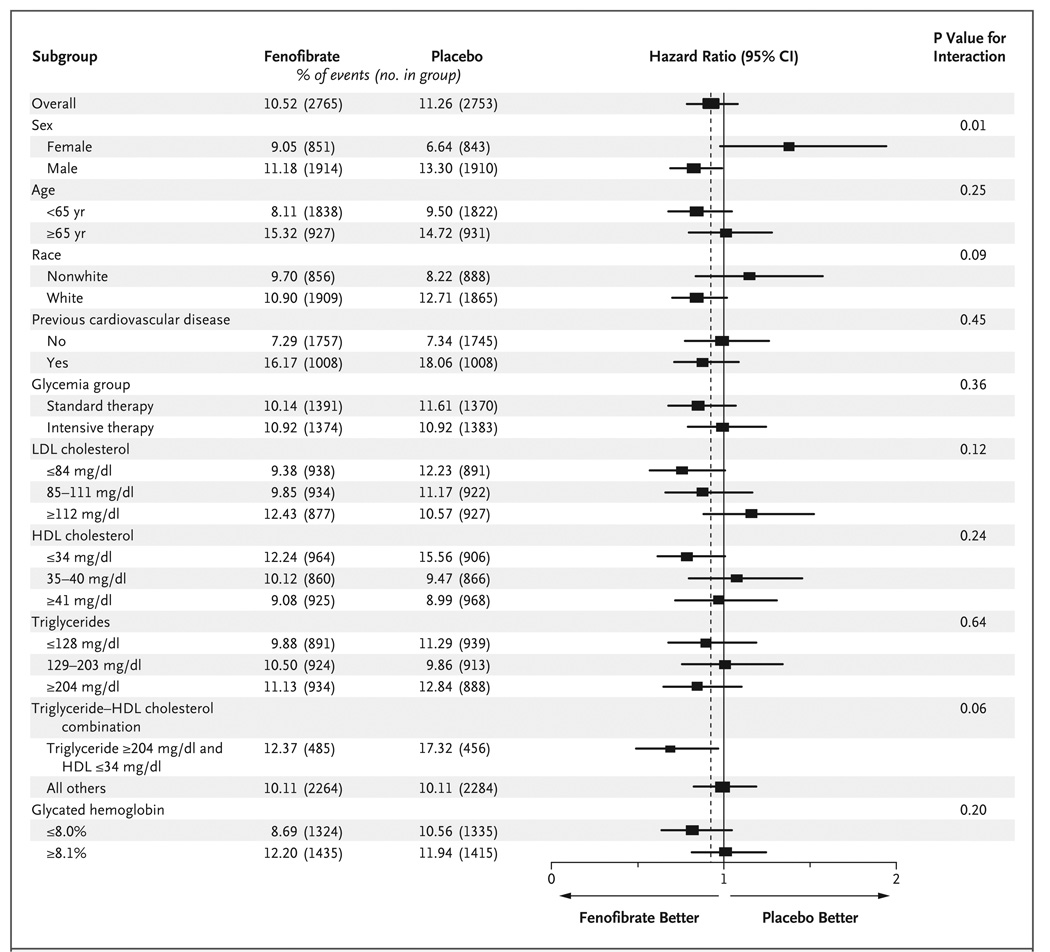
Figure 3. Hazard Ratios for the Primary Outcome in Prespecified Subgroups.
The horizontal bars represent 95% confidence intervals, and the vertical dashed line indicates the overall hazard ratio. The size of each square is proportional to the number of patients. P values are for tests for interaction. To convert the values for cholesterol to millimoles per liter, multiply by 0.02586. To convert the values for triglycerides to millimoles per liter, multiply by 0.01129.

