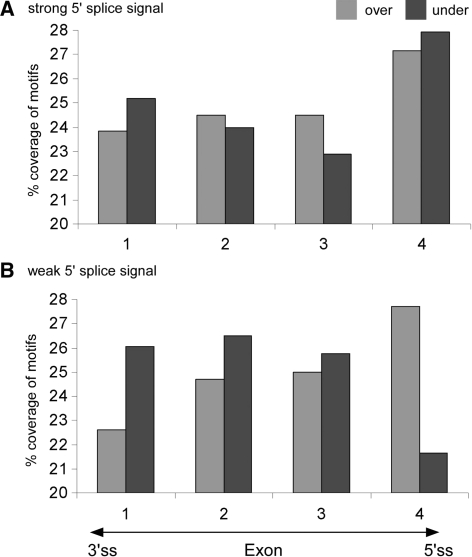
Figure 4.
Comparison between the distributions of over-abundant and under-represented motifs along exons. The distribution of the over-abundant (light gray bars) and under-represented (dark gray bars) sequence overlaps along exons was calculated for exons with (A) strong 5′ splice signals and (B) weak 5′ splice signals. Exon sequences were divided into four equally sized quartiles (x-axis). The percentage of nucleotides which are part of over-abundant or under-represented motif overlaps in each of the four quartiles is indicated (y-axis).

