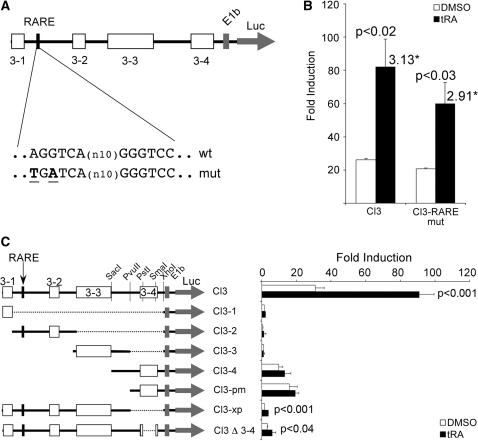
Figure 3.
Stimulation of conserved cluster 3 is indirect and distinct from that in thyroid cells. (A) Map of Cl3, conserved regions are represented by boxes labeled 3-1 to 3-4, the previously characterized RARE is indicated by the black box, the wild type and the mutant sequences are shown below the map. (B) MCF-7 cells were transiently transfected with either the wild type or the mutant construct, cells were treated with tRA or DMSO and luciferase assays were performed. (C) Several deletion mutants were prepared to study the transcriptional potential in response to tRA stimulation of individual or combined conserved regions of Cl3. Plasmids were transfected to MCF-7 cells, followed by tRA (or the vehicle DMSO) treatment for 24 h, then luciferase assays were performed. The luciferase values were normalized to those of Renilla luciferase; fold induction was calculated relative to the empty vector. *Numbers above bars indicate the overall fold stimulation by tRA. P-values for the tRA-induced samples were calculated using paired Student’s t-test with 95% confidence interval, values <0.05 were considered significant.

