Figure 5.
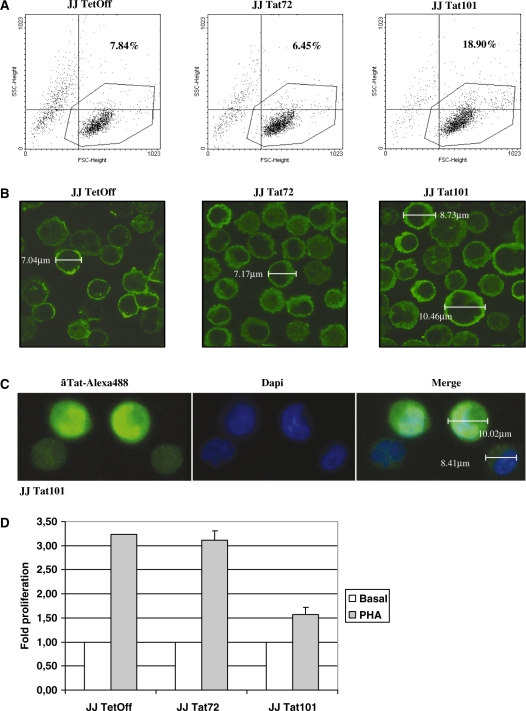
Changes in cell morphology and proliferation induced by Tat intracellular expression. (A) Relative cell size (forward scatter, FSC) and complexity (sideward scatter, SSC) of Jurkat-Tat72 and Jurkat-Tat101 was analysed by flow cytometry after staining with propidium iodide. Representative SSC/FSC dot plots for each cell type were selected from three independent experiments. Percentage of cells inside the dot plot upper right quadrant corresponds to cells with higher size and complexity than control cells. (B) Jurkat-Tat72 and Jurkat-Tat101 were analysed by confocal microscopy after staining with an antibody against β-actin and a secondary antibody conjugated with Alexa 488. Cell diameter was calculated in some selected cells. (C) Analysis of Jurkat-Tat101 by confocal microscopy after staining with a monoclonal antibody against Tat and a secondary antibody conjugated with Alexa 488 confirmed that cells with higher size were also expressing higher amounts of intranuclear Tat. Dapi was used for nuclear staining. Cell diameter was measured in cells expressing high or low levels of Tat. (D) PHA-induced proliferation was measured in both Jurkat-Tat72 and Jurkat-Tat101 in comparison with control cells. The histogram shows the fold-change mean of three different experiments and lines on the top of the bars represent the SD.

