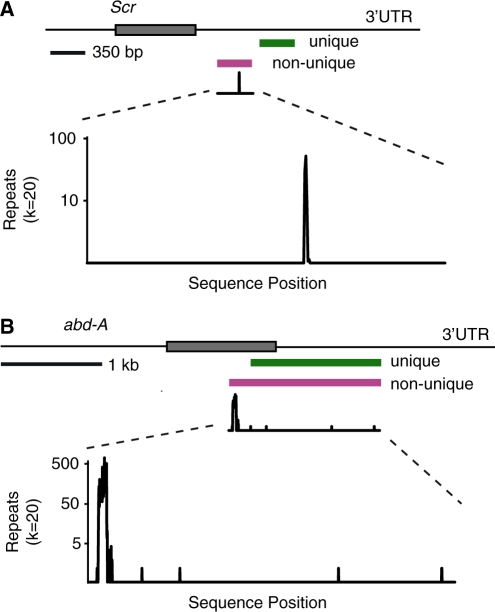
Figure 2.
Scr and abd-A probes with and without 20-mer repeats. The lines at the top represent mature mRNA sequences for the Scr (A) and abd-A (B) genes, with the positions of probe regions denoted beneath. The shaded boxes represent the open reading frames of the respective mRNAs. Below the non-unique probes is shown the graphical output from the RepeatMap program, set to detect repeated sequences of 20 nt. The Y-axis log10 scale shows the number of times a k-mer repeat (k = 20) is found elsewhere in the D. melanogaster genome. The X-axis plot shows the nucleotide position of the repeat within the probe sequence.

