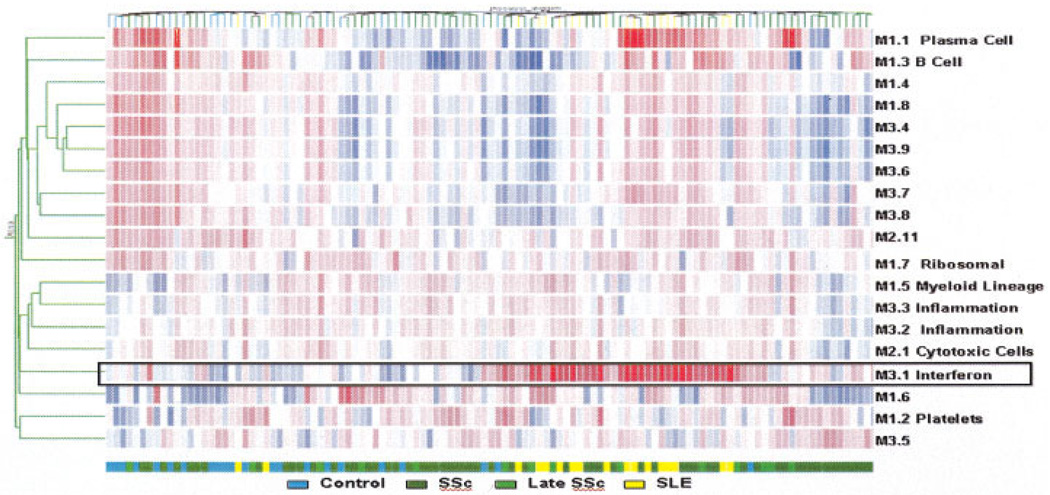
Figure 2.
Mapping modular blood transcriptional activity. The heatmap represents levels of activity for a set of predetermined transcriptional modules. Average gene expression levels were obtained for each module. For each patient, 28 vectors were thus obtained, and the data set was subjected to an unsupervised analysis: modules for which at least 1 sample showed a deviation from the median of >1.5-fold were selected and arranged based on their activity pattern across patients. Conversely, patients were arranged using the same hierarchical clustering algorithm based on their activity patterns across modules. Red indicates a relative increase in transcriptional activity; blue indicates a relative decrease. The distribution of the different study groups is indicated by a color code. Functional interpretations available for some of these modules are also provided. See Figure 1 for definitions.

