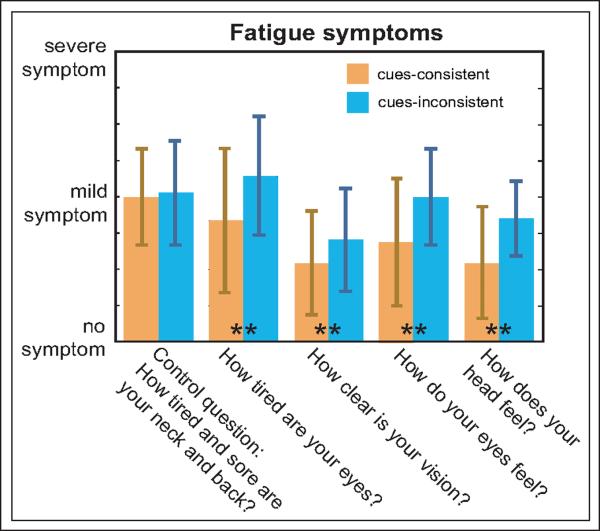
Fig. 6.
Results from the visual-fatigue experiment. The average symptom severity is plotted for each of the five questions. Orange and blue bars represent the data from the cues-consistent and cues-inconsistent sessions, respectively. Error bars are the standard deviation of reported symptoms from the 17 sets of observations (11 subjects, 6 tested twice). ** indicates p<0.025.

