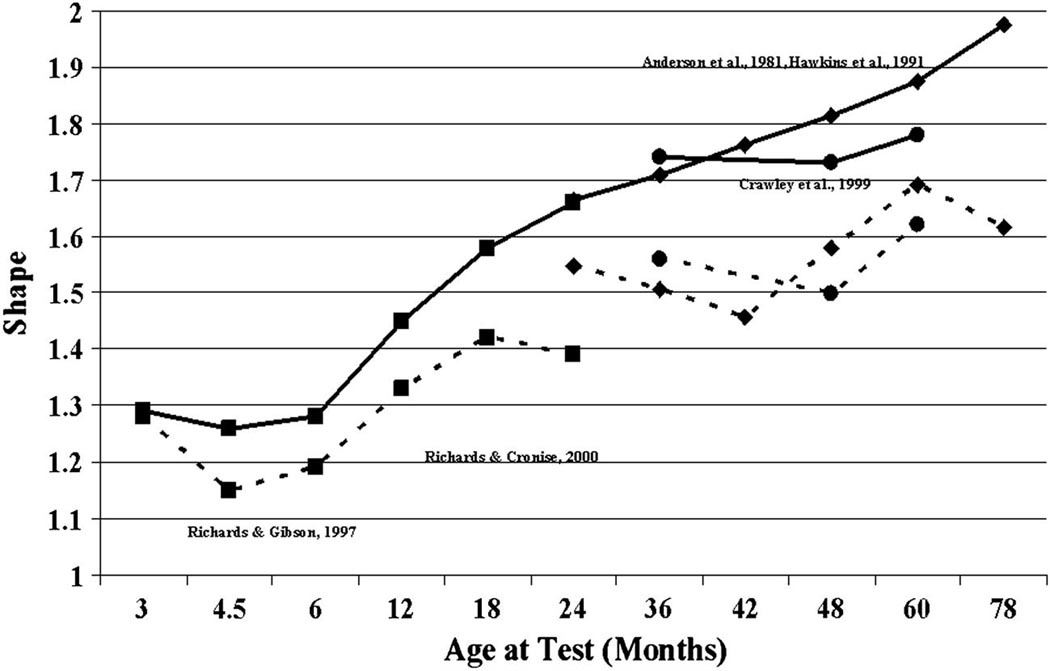
Figure 9.
The shape parameter of the lognormal distribution, shown separately for the comprehensible and incomprehensible stimuli and for each testing age. The solid lines in each case represent the comprehensible stimuli and the dashed lines represent the incomprehensible stimuli. (from Richards & Anderson, 2004)..

