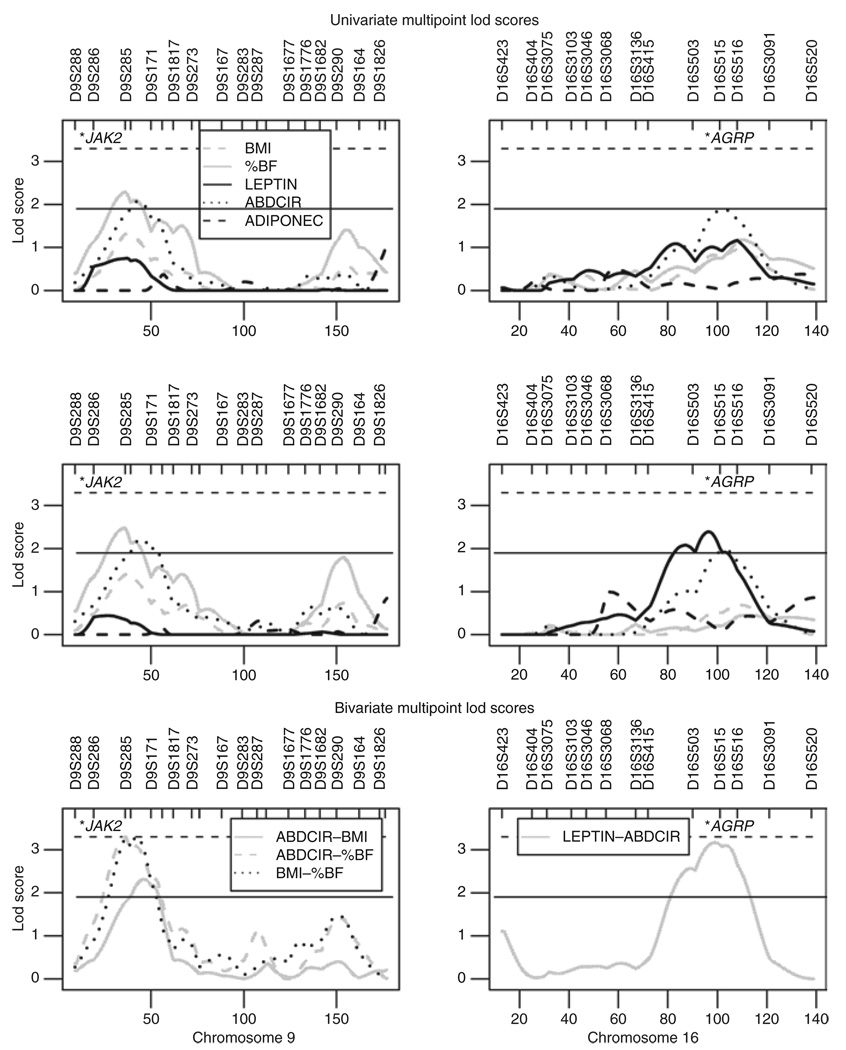
Figure 1.
Multipoint linkage results from chromosomes 9 (left column) and 16 (right column). The top row shows univariate linkage when adjusted for the basic covariate set. The middle row shows univariate linkage results when the environmental set was screened for. The bottom row shows bivariate multipoint lod scores. Genome-wide significance (lod 3.3) is indicated by the horizontal dashed line, and suggestive linkage is indicated by the horizontal solid line (lod 1.9). The locations of potential candidate genes, JAK2 and AGRP, are indicated with asterisks.

