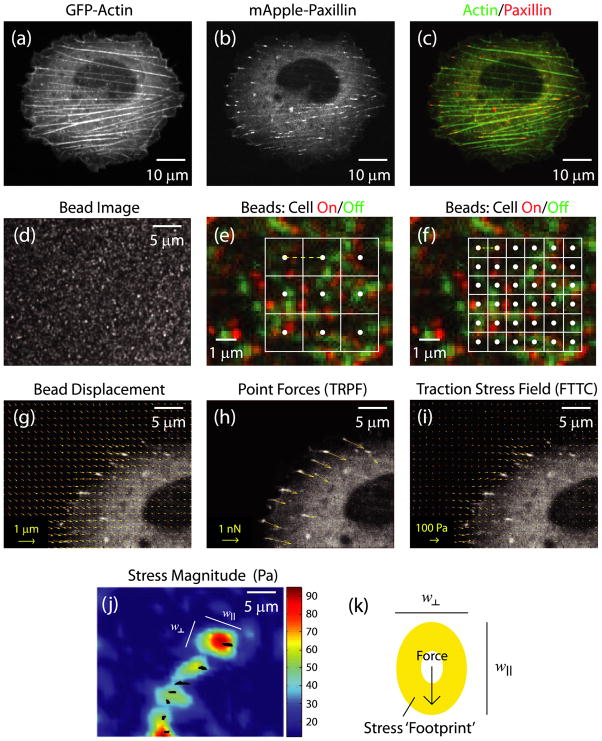
Figure 2.
Live cell image of a U2OS cell expressing (a) GFP-actin and (b) mApple-paxillin. (c) Color combine with actin in green, paxillin in red. (d) Image of 40 nm far red fluorescent beads used as fiducial markers to track substrate displacements. (e) and (f) Magnified view of a small region of a bead image with the beads from the ‘cell-off’ image in green and beads from the ‘cell-on’ image in red. Overlaid are grids with a spacing of 0.86 μm (e) and 1.71 μm (f). The white dots at the center of each box indicate the origin of the displacement vector and the yellow dashed line represents the grid size. (g)–(j) Magnified image of upper left part of the cell shown in (a)–(c) overlaid with (g) bead displacement vectors, (h) point force vectors using the TRPF method and (i) stress vector field from FTTC method. (j) Heat map of stress magnitude using data from (i). The black marks indicate the location of focal adhesions. The two lengths (w|| and w⊥) are defined as the principle axes of the ellipsoidal area subtended by the region around focal adhesions where the traction stress is larger than the background. w|| indicates the length of the axes in the direction parallel to the traction stress vector, while w⊥ indicates the length of the axes in the direction perpendicular to the application of stress. (k) Cartoon of a focal adhesion (white circle) applying a force to the substrate, and the resultant stress footprint from the FTTC method.

