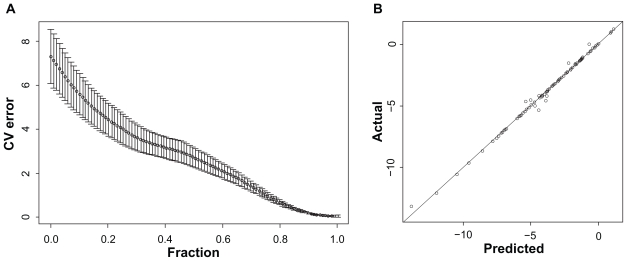
Figure 2.
Simulated data with no noise using LASSO. Part A shows the relationship between the cross-validated estimate of prediction error to model size for the corresponding models. The confidence bars are output by the R function ‘cv.lars’. The x-axis stands for fraction, which refers to the ratio of the L1 norm of the coefficient vector relative to the norm at the full LS solution for the model with the maximum steps used. Part B shows the relationship of predicted and observed response for the optimal model.

