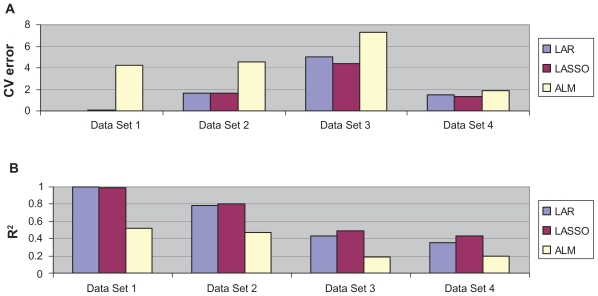
Figure 3.
Comparison of LAR, LASSO, and ALM on simulated and real data sets. Data Set 1: Simulated data with no noise; Data Set 2: Simulated data with 1 SD noise; Data Set 3: Simulated data with 2 SD noise; Data Set 4: real data.22 Part (A) shows the cross validated global minimum estimated squared prediction errors. Part (B) shows the association between observed and predicted responses (R2).

