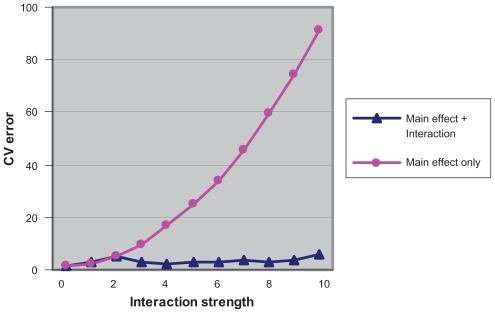
Figure 4.
Comparison of the performances of the models including main effects only and the model including nonlinear terms on the lung cancer cyto-toxicity data set.22 The x axis is the levels of strength of the two way interaction added to the true response. The y axis is the cross validated estimate of prediction error. The line with squares stands for the models with main effects only, while the line with triangles stands for the models including main effects and interactions.

