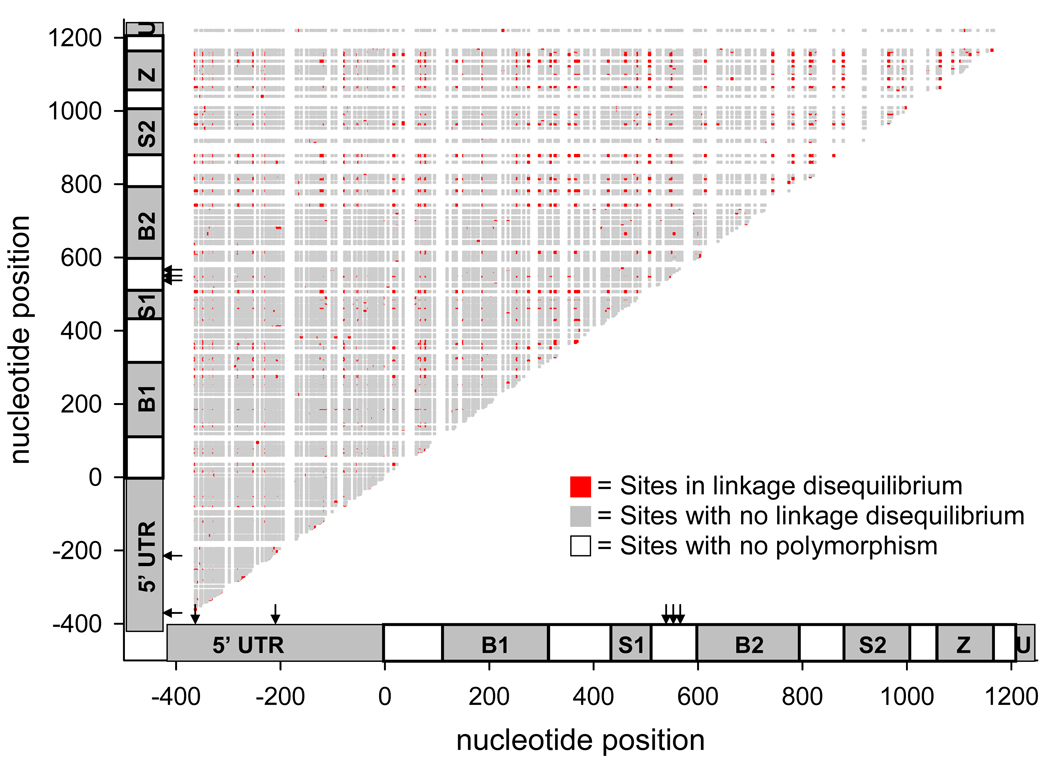
Figure 5. A half-matrix showing linkage disequilibrium coefficient D2ST between AtIAP1 segregating sites.
The abbreviations in the genetic schematic represent individual domains as follows. 5’UTR = 5’ untranslated region, B1 = 1st BIR domain, S1 = 1st serine rich domain, B2 = 2nd BIR domain, S2 = 2nd serine rich domain, Z = Zing ring finger motif, and U = 3’ untranslated region. The coding region begins at nucleotide 0 and ends at nucleotide 1,212. Potential QTNs conditioning transovarial infection with LACV, as determined by complete sequence analysis with PGtheta, are found at positions −361, −268, 542, 555, and 570 and are marked with arrows.

