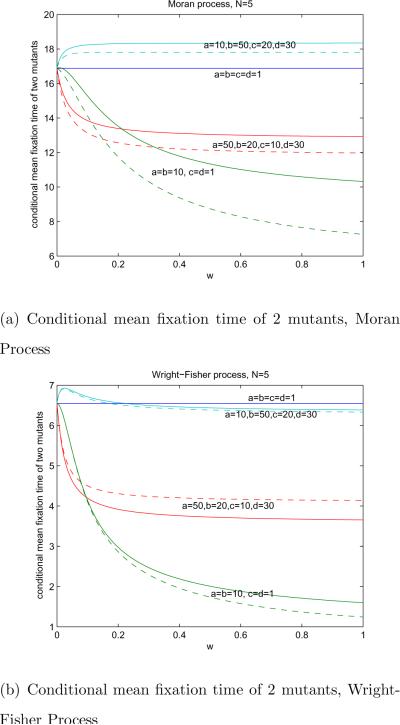
Figure 2.
Conditional mean fixation time of 2 mutants of strategy A and B as a function of selection strenght w for different payoff matrices. N = 5. Top figure: Moran process; the conditional mean fixation times of 2 A mutants (solid line) and that of 2 B mutants (dashed line) are different for all w ≠ 0. Bottom figure: Wright-Fisher process; the conditional mean fixation time of 2 A mutants (solid line) and that of 2 B mutants (dashed line) are different, however they are very close for small w.

