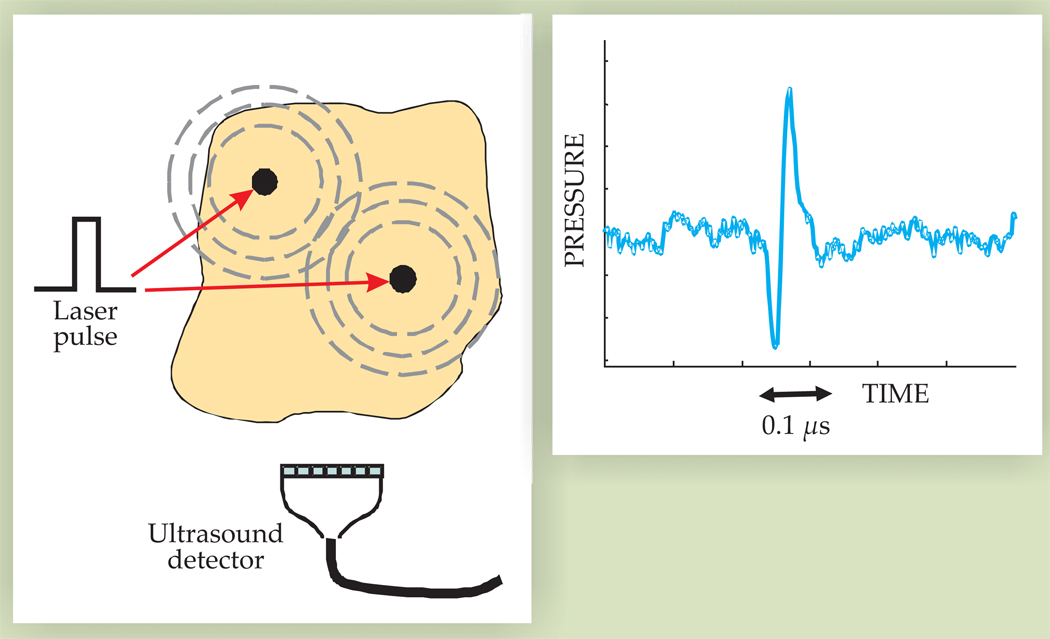
Figure 3.
Photoacoustic generation and detection. Black dots in the left panel represent regions of high optical absorption. When heated by a laser pulse, they launch acoustic waves, which are picked up by an ultrasound detector. The ultrasound waveform shown in the right panel is approximately proportional to the time derivative of the optical pulse.

