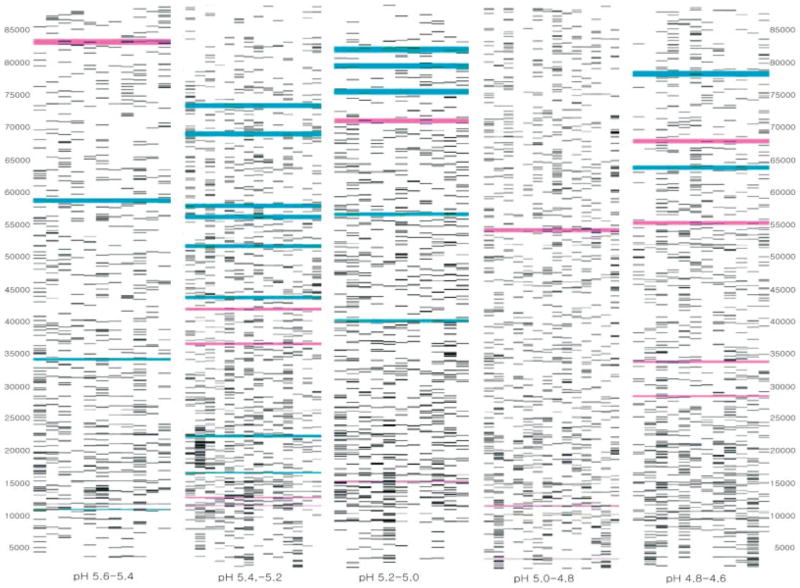
Figure 1.
Comparison of mass maps showing protein expression differences between low stage (stage 1) and high stage (stage 3/4) ovarian endometrioid tumors across several pH ranges. The blue bands represent over-expression of proteins in the high stage tumors. The purple bands represent over-expression of proteins in the low stage tumors.

