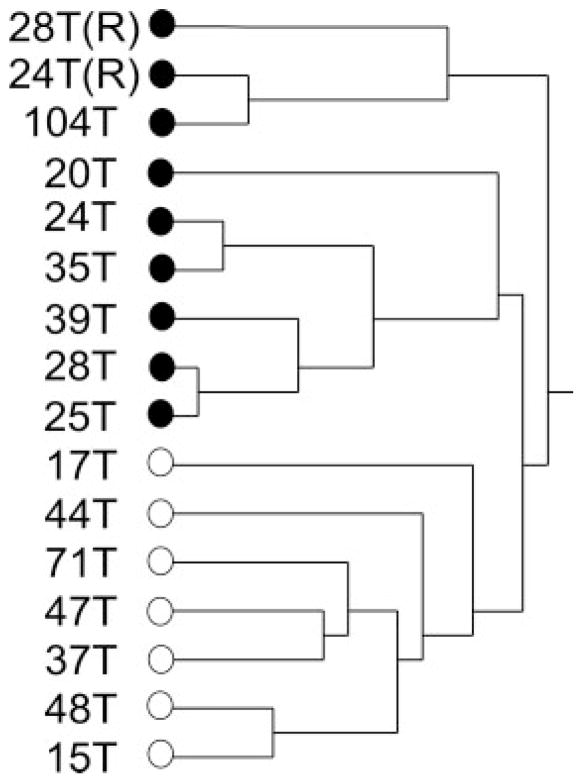
Figure 6.
Hierarchical clustering dendrogram of the OEAs utilized in this study. Included in the dendrogram are the two repeat sample analyses (OE-28T(R) and OE-24T(R)), corresponding to tumors OE-28T and OE-24T, respectively. Also included are the two tumors (OE-37T and OE-104T) whose stage and mutational status was not revealed to the investigators until after analysis was completed. White dot: low stage (stage 1). Black dot: high stage (stage 3/4).

