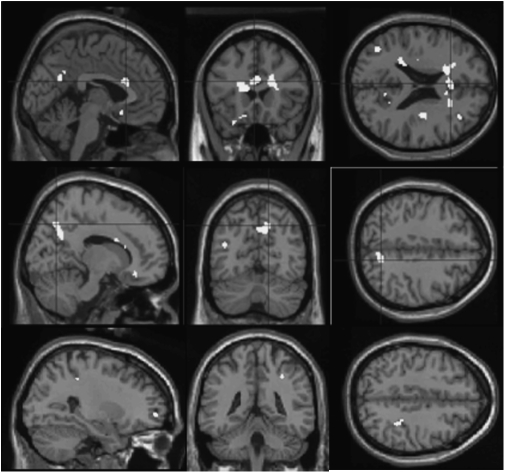
Fig. 5.
Regions in Which Better Performing Patients Activate More Strongly Than Worse Performing Patients, Masking Out Areas Activated by Control Subjects, So Indicating Patient Specificity. Upper and middle panels show causal learning; lower panels show reward learning (P < .005). The contrast identified regions that differentiate better from worse performing patients more than they differentiate better from worse performing control subjects, masked inclusively by better learning patients greater than worse performing patients and masked exclusively by better learning control subjects greater than worse learning control subjects. See online supplementary material for a color version of this figure.

