Figure 9.
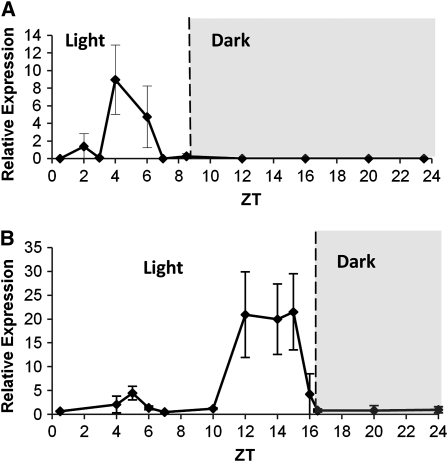
Expression Pattern of DNF.
(A) Expression of DNF in wild-type plants in 8-h SDs.
(B) Expression of DNF in wild-type plants in 16-h LDs. Expression levels were determined by quantitative RT-PCR and are normalized to β-Actin. Data points represent an average of two experimental replicates each with three technical replicates. Error bars represent sd.

