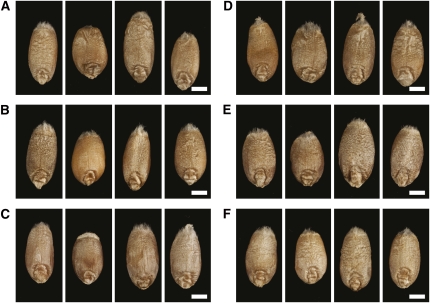
Figure 1.
Phenotypic Variation in Grain Size and Shape in Six DH Mapping Populations.
AxC (A), BxS (B), SxS (C), SaxR (D), SpxR (E), and MxC (F). Within each panel, the grains at the extremities correspond to the parental lines following the order (i.e., left or right) of the cross, while the two middle grains correspond to extreme DH lines. Bars = 2 mm.
[See online article for color version of this figure.]

