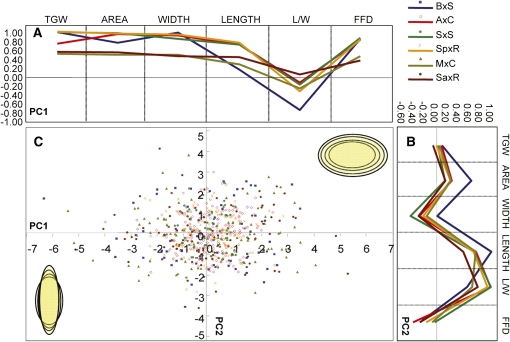
Figure 2.
A Morphometric Model for Variation in Grain Morphology in Wheat Mapping Populations.
(A) and (B) Variation in grain size is captured by PC1 with both grain length and width having large effects, whereas PC2 describes variation in grain shape largely through changes in grain length. Component loading (i.e., correlations between the variables and factor) for PC1 (A) and PC2 (B) for each population are color coded.
(C) Score distribution for PC1 and PC2. Schematic representation of variation in grain size and shape captured by PC1 (x axis) and PC2 (y axis), respectively.

