Figure 5.
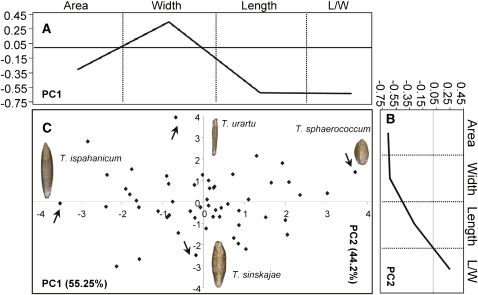
A Morphometric Model for Variation in Grain Morphology in Ancestral Wheat Species.
Variation in grain shape and size is captured by PC1 and PC2, respectively.
(A) and (B) Component loading for PC1 (A) and PC2 (B), as in Figure 2.
(C) Score distribution for PC1 and PC2. Grains of the species that correspond to extreme size or shape phenotypes (arrows) are shown. Variation explained by each principal component is shown in parentheses.
[See online article for color version of this figure.]

