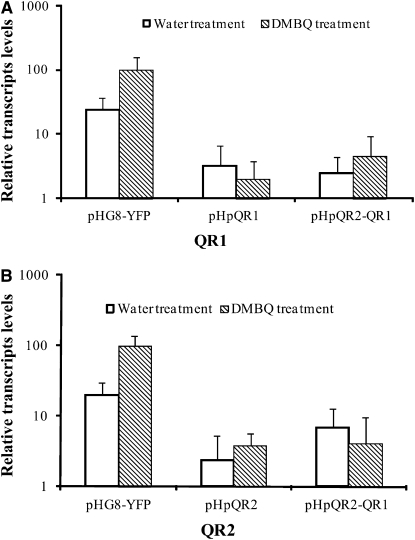
Figure 3.
Transcript Levels of QR1 and QR2 in Transgenic Roots.
Steady state transcript levels of QR1 and QR2 were determined by real-time PCR and normalized to the constitutively expressed gene QAN8 for each sample. Data are means ± sd of two technical replicates of three to four plants (n = 6 to 8). Expression levels in pHG8-YFP transgenic roots treated with DMBQ was set to 100%. Note the log scale y axis. (A) QR1 expression.
(B) QR2 expression.

