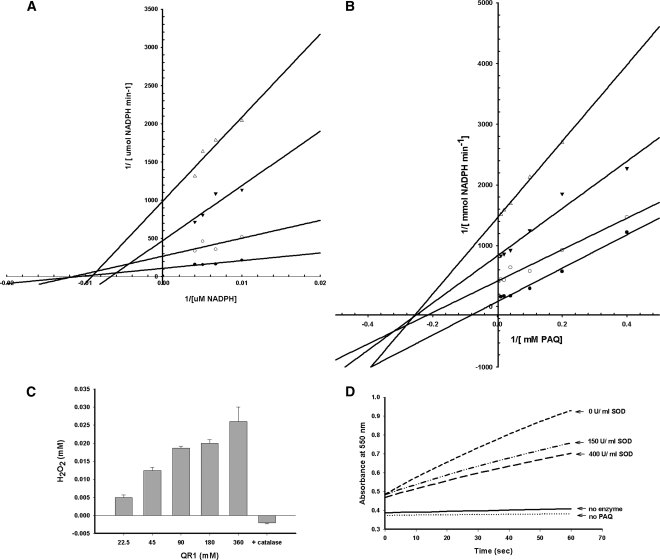
Figure 7.
Enzymatic Activity and Substrate Specificity of QR1.
(A) and (B) Inhibition of activity by dicumarol as measured by varying concentrations of PAQ (A) or NADPH (B). The four lines in each graph indicate different concentrations of dicumarol. Closed circles correspond to 0 μM dicumarol, open circles correspond to 10 μM dicumarol, closed triangles correspond to 25 μM dicumarol, and open triangles correspond to 100 μM dicumarol. Each point represents the mean of triplicate trials.
(C) H2O2 generated from different concentration of QR1 in the standard PAQ reduction assay. Addition of 0.1 mg/mL of catalase abolished the hydrogen peroxide signal.
(D) Reduction of cytochrome c by QR1. Activity was followed by recording the cytochrome c reduction at 550 nm. Lines show absorbance changes over time without enzyme, without PAQ, the complete assay system without superoxide dismutase, and the complete assay system with superoxide dismutase concentrations 150 and 400 units/mL.

