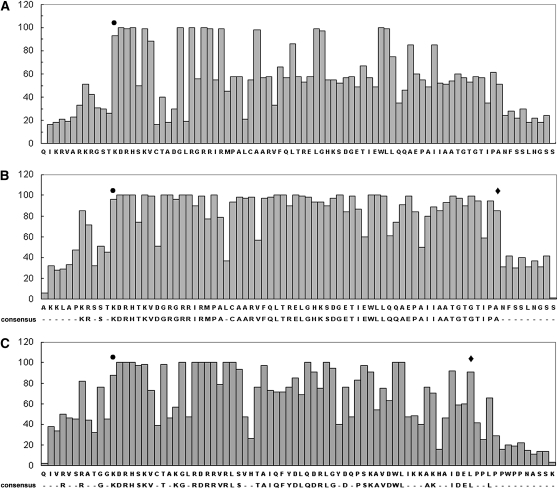
Figure 2.
Amino Acid Conservation in the TCP Domain.
The URF values (see Results) are plotted along the y axis, and the amino acid positions of the domain are shown along the x axis. Analysis is performed with 206 TCP domains belonging to both the classes (A), 121 class I domains (B), or 85 class II TCP domains (C). Predicted left and right borders of the domains are marked by circles and diamonds, respectively. The consensus sequences using ≥50% URF value are given below the x axis.

