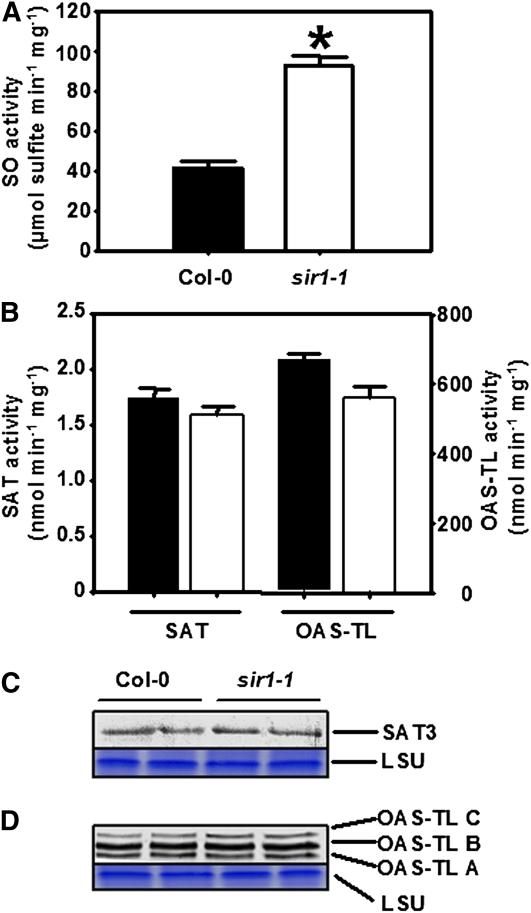
Figure 6.
Abundance and Activity of SO, SAT, and OAS-TL in Leaves of sir1-1 Plants.
(A) Specific activity of SO in protein extracts of 7-week-old wild-type (black) and sir1-1 (white) plants that were grown on soil under short-day conditions.
(B) Specific activity of SAT and OAS-TL from the same extracts as in (A). The specific activities of SO, SAT, and OAS-TL were determined for each extract in triplicates with varying amounts of proteins to prove time and protein linearity of measurement (n = 5 to 7). Means ± se are shown. The asterisk indicates a statistically significant (P < 0.05) difference from the wild-type value.
(C) An immunoblot loaded with soluble protein from two extractions each of the leaves from the wild type and sir1-1 was decorated with At-SAT3 polyclonal antiserum.
(D) Same experimental set up as in (C), but a polyclonal antiserum against At-OAS-TLC was used, which also detects At-OAS-TL A and B. Staining of the large subunit of ribulose-1,5-bisphosphate carboxylase/oxygenase (LSU) with Coomassie blue was used to confirm equal loading of lanes.
[See online article for color version of this figure.]

