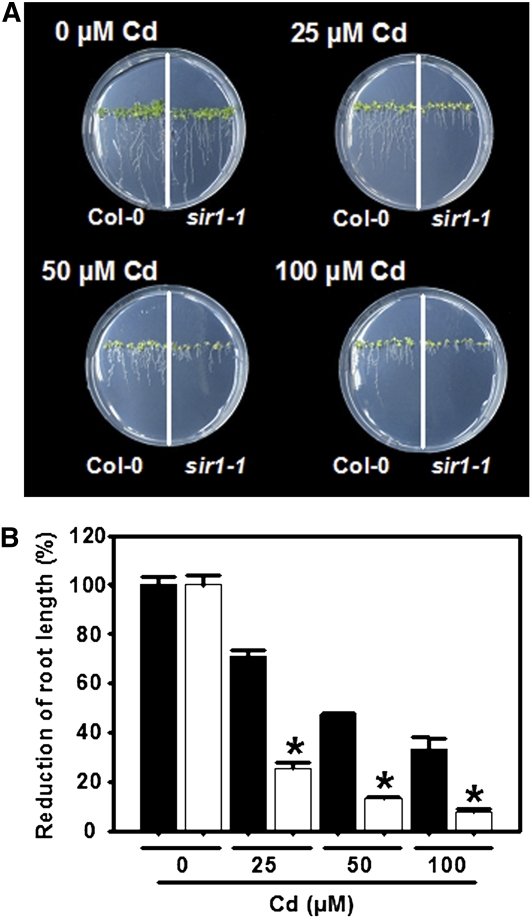
Figure 8.
Cadmium Sensitivity of sir1-1 Plants.
(A) Top views of wild-type (Col-0, left) and sir 1-1 (right side) plants grown for 15 d on At-medium supplemented with varying concentrations of cadmium (0 to 0.1 mM CdCl2).
(B) Quantification of root growth of wild-type (black) and sir1-1 (white) plants grown as in (A). To allow comparison between wild-type and sir1-1 plants, the root growth is shown as percentage of growth of the respective line under nonstress conditions. Mean ± se are shown (n = 6 to 10). Asterisks indicate statistically significant (P < 0.05) differences from wild-type plants grown at the same concentration of Cd.
[See online article for color version of this figure.]

