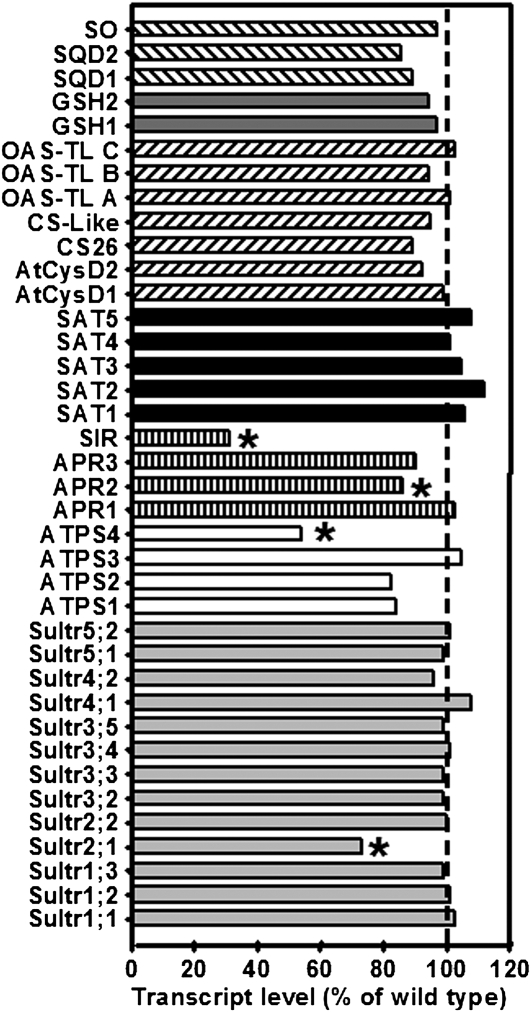
Figure 9.
Transcript Levels of Sulfur Metabolism-Related Genes in Leaves of sir1-1 Plants.
The transcript levels of sulfur metabolism related genes in leaves of sir1-1 and wild-type plants (Col-0) grown on soil under short-day conditions for 7 weeks were compared using a targeted microarray approach. Total mRNA was extracted from three individuals of each plant line, labeled independently two times with Cy3 and Cy5, and cohybridized with the microarray twice (n = 12). From bottom to top: The transcript levels of genes encoding sulfate transporters (light-gray bars), ATPS (white bars), sulfate-reducing enzymes (striped bars), SATs (black bars), OAS-TLs (inclined dashed bars), proteins participating in GSH synthesis (dark gray bars), and sulfolipid biosynthesis enzymes (declined dashed bars) in sir1-1 plants are shown as percentage of wild-type levels. Asterisks indicate statistically significant (P < 0.05) differences from wild-type expression levels of the same gene.

