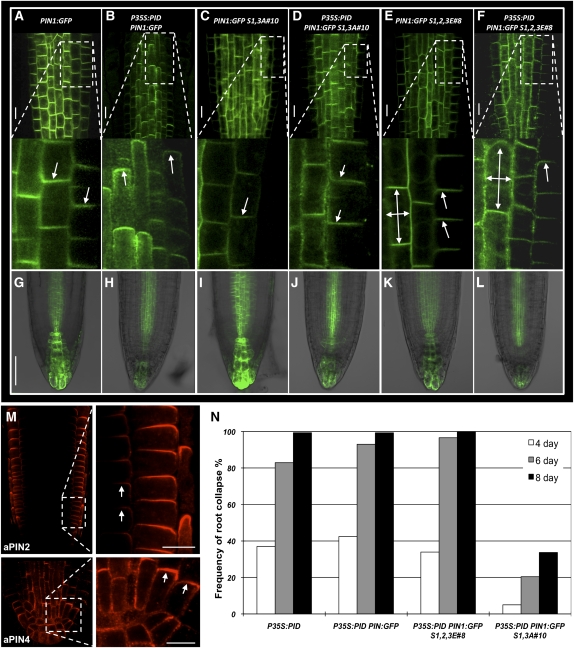
Figure 7.
PIN1:GFP Polarity Changes Induced by Manipulation of Phosphoserines Correlate with Changes in the Auxin Maximum in the Root Tip.
(A) to (F) Confocal laser scanning microscopy of primary roots of 5-d-old seedlings expressing PIN1:GFP ([A] and [B]), PIN1:GFP S1,3A#10 ([C] and [D]), and PIN1:GFP S1,2,3E#8 ([E] and [F]) in the wild-type ([A], [C], and [E]) or P35S:PID ([B], [D], and [F]) background. The white dashed boxes in the overview images (top) indicate the position of the zoomed-in images (bottom), in which the PIN1:GFP polarity is indicated by arrows. The seedlings are homozygous for the indicated T-DNA constructs. Bars = 5 μm.
(G) to (L) Confocal laser scanning microscopy of PDR5:GFP signals in 3-d-old seedling root tips expressing PIN1:GFP ([G] and [H]), PIN1:GFP S1,3A#10 ([I] and [J]), and PIN1:GFP S1,2,3E#8 ([K] and [L]) in the wild-type ([G], [I], and [K]) or P35S:PID ([H], [J], and [L]) background. The seedlings are heterozygous for the PDR5:GFP reporter. Bar = 50 μm.
(M) PIN2 and PIN4 immunolocalization in 3-d-old P35S:PID PIN1:GFP S1,3A#10 seedling roots. The arrows indicate the apical PIN2 and PIN4 localization induced by PID overexpression. Bars = 5 μm.
(N) Quantification of the effects of wild-type, loss-of-phosphorylation, or phosphomimic PIN1:GFP expression on the PID overexpression-induced root meristem collapse phenotype. Percentages are based on scoring 153, 144, 179, and 98 seedlings at 4, 6, and 8 d after germination.

