Figure 8.
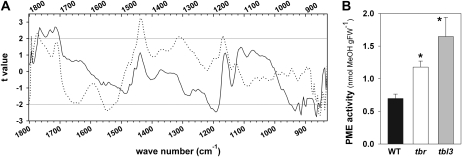
FTIR spectra and PME activity in tbr and tbl3 mutants. A, FTIR spectrum from 4-d-old, dark-grown tbr (dotted line) and tbl3 (solid line) mutant hypocotyls. Student's t test values for the comparison between the wild type and tbr or tbl3 (x axis) are plotted against the wave numbers (y axis). Horizontal gray lines refer to the significance threshold (P = 0.95). Several highly significant maxima can be assigned to pectin ester linkages and alterations in cell wall crystallinity. B, Measurement of PME activity isolated from etiolated seedlings. The mean values of PME activity are expressed as release of methanol in nmol g−1 fresh weight (FW) derived from wild-type (WT), tbr, and tbl3 seedlings. Mean values ± se are shown (n = 5). Significant changes (P ≤ 0.01) as deduced from Student's t test are marked with asterisks.

