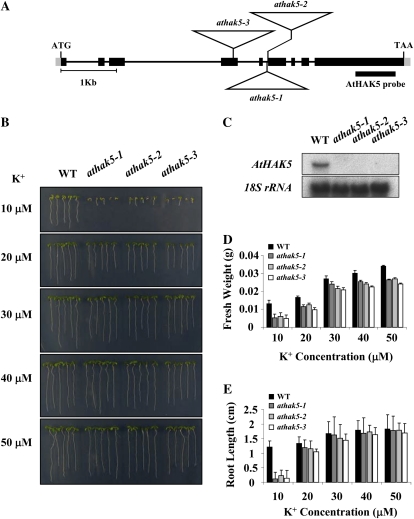
Figure 1.
Isolation of the athak5 T-DNA insertional mutants, and K+-dependent growth analysis. A, Structure of the AtHAK5 gene. Boxes represent exons, and lines represent introns. The positions of the T-DNA insertions in athak5-1 (SALK_014177), athak5-2 (SALK_005604), and athak5-3 (SALK_130604) are represented by triangles. T-DNA is not drawn to scale. B, The wild type (WT) and athak5 mutant alleles grown for 7 d on medium containing KCl at the concentrations indicated. C, Northern-blot analysis of AtHAK5 transcript levels in the wild type and athak5 mutant alleles. A total of 20 μg of RNA was isolated from 7-d-old seedlings grown on medium containing 50 μm K+. D, Fresh weight of 7-d-old wild-type and athak5 mutant plants. Each bar represents the mean fresh weight (n = 4) of 25 seedlings ± sd. E, Root length of 7-d old wild-type and athak5 mutant plants. Each bar represents the mean root length (n = 4) of 25 seedlings ± sd. [See online article for color version of this figure.]

